


From Traffic Data to Green Lights
Mastering the Craft of Traffic Signal Timing

For new engineers and technologists entering the field of traffic engineering and traffic operations, the concept of developing a traffic signal timing plan may initially seem daunting. However, with time, practice, repetition, and an intuitive understanding of the more artistic aspects of such practices, the process becomes more manageable.
I wish to take the opportunity to summarize some key points and perspectives that I have observed and utilized in my journey toward developing traffic signal timing plans. It's essential to note that while this approach is based on my personal experience, it should not be considered gospel. There may be varying ways to approach these problems and tasks, and I simply want to share the approach that has served me well in my time and experience.
Also, as an important disclaimer, please refer to your jurisdiction’s traffic signal timing procedures, guidelines, regulations, and legislation it may differ from what is stated below. The discussion below is primarily based on my experience in Ontario, Canada and working with the Ontario Traffic Manual (OTM).
Step One: Data Collection and Analysis
The initial step in the process involves thorough data collection and analysis. Understanding the actual traffic demands on the streets is crucial. Modern technologies, such as video data capture systems, have greatly streamlined this process compared to the manual counting methods used when I began my career. For example, I remember one summer sitting at an intersection near the beach in the shade, counting vehicles and people. Despite recent technological advancements, there remains a need for a thoughtful approach to applying and interpreting the collected data. Further, newer automated data collection systems and emerging artificial intelligence similarly provide new data opportunities now being explored.
When capturing data at an intersection, these efforts typically occur on a recurring basis every several years, essentially providing a snapshot in time. However, the challenge lies in discerning whether the collected data reflects typical travel demands or is influenced by atypical factors including construction or a vehicle collision diverting traffic. While newer automated technologies, such as video data collection, can be conducted more regularly and integrated into adaptive traffic signal systems, the traditional approach remains more typical in most cases.
Once the data is collected, it is beneficial to store it in an easily retrievable database that allows analysis of both current and historical counts. This facilitates tracking changes over time and reviewing recently collected data. Comparing recent counts becomes especially helpful when making judgment calls during the development of transportation models for analysis.
In my experience, I recommend that jurisdictions develop transportation models that can be quickly utilized to test scenarios and answer questions related to traffic signals. While demand-level modelling can be done through higher-level models such as Emme, Visum, or AIMSUN, for traffic signal timings, meso-level or micro-level models such as Synchro, Vistro, and Vissim prove to be the most effective tools. These models enable quick adjustments as new construction projects and geometries evolve, providing quicker evaluation and implementation of timing plans.
Step Two: Identify Signal Phasing
The development of traffic signal timings begins at the intersection design phase, where signal phasing diagrams are crafted as part of the legal drawings (known as PHMs in Ontario). Signal phasing primarily considers the physical geometric design of the intersection to be signalized including traffic signal heads and their placement around an intersection, incorporating the needs of individual lanes and pedestrian crossings.
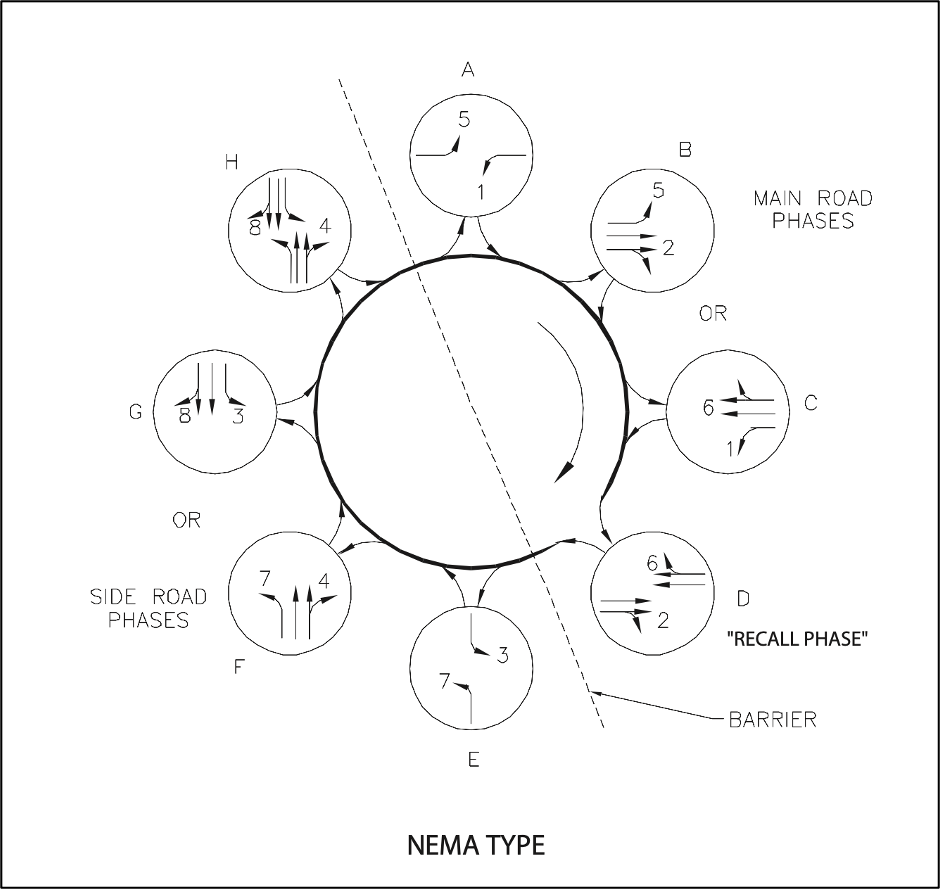
In this regard, a more conventional NEMA phase sequence is often used in North America, representing a traffic signal structure of eight phases - see below. Although traffic signal controllers and cabinets can now support larger phase structures (i.e. many newer traffic controllers can accommodate up to 32 phases), the standard convention currently adheres to the first eight phases.
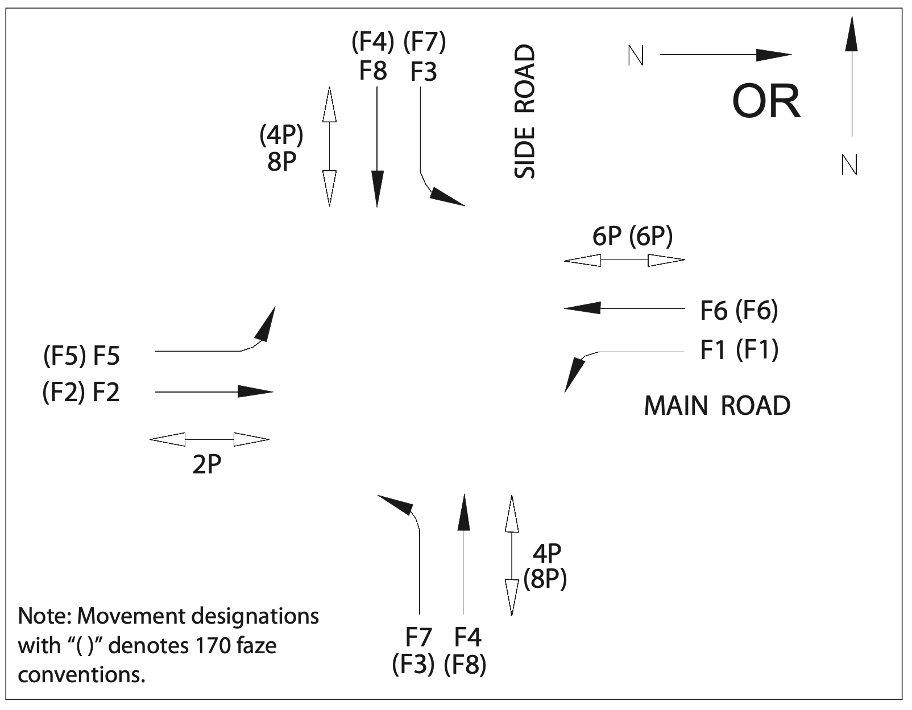
Utilizing the legal drawings (also known as PHMs in Ontario), the phase sequence is visually represented, with each drawing illustrating the ongoing progression of phases. This includes details such as the Main Street having greens or advanced turns, transitioning to side street green lights, and then returning to the main street. This crucial information must be thoroughly examined when designing a traffic signal timing plan, as legal drawings serve as the foundation for determining how the phase structure progresses.
In most cases, the phase structure outlined in legal drawings remains unchanged. However, if construction is underway or modifications (such as adding an advanced left turn arrow), are being considered, a reassessment becomes necessary. Ensuring that physical infrastructure aligns with the proposed changes in the field is imperative before implementing a new traffic signal timing plan.
Step 3: Coordination with Adjacent Intersections
It is important to consider how the signal timings at one intersection will impact traffic flow at nearby intersections. Coordination between intersections is essential to ensure smooth traffic progression and platooning of vehicles between intersections and along a corridor.
To maximize traffic flow along a continuous corridor, maintaining the same cycle length is important. Modelling software (such as Synchro) can assist in determining the recommended cycle length for an individual intersection once the data from that intersection has been input into the model. Various factors should be considered when choosing a longer or shorter cycle length.
Following guidance from OTM Book 12, the useful range of cycle lengths is typically considered between 50 and 120 seconds. In my career, I have also observed larger cycle lengths, sometimes reaching values as high as 150 or 180 seconds. Although I do not prefer such high cycle lengths, it's important to note that shorter cycle lengths are more suitable for compact urban environments with higher pedestrian demands and short block lengths. However, shorter cycle lengths result in higher lost time due to proportionally higher amber clearance and all-red lost time when considering multiple repeating cycles. On the other hand, longer cycle lengths are more appropriate for larger intersections in suburban areas but lead to increased wait times, longer vehicle queues, and are less pedestrian-friendly.
Choosing when to transition a cycle length along a larger corridor may present a challenge when required. While it is generally preferred to keep a singular cycle length, in some cases this may not be possible. For example, opting for a transition point at the intersection of two major arterial corridors, where high traffic demands and expected delays exist, can serve as a useful transition point. Also, it is possible to change cycle lengths along a corridor in areas with fewer traffic signals and larger gaps between two signalized intersections, where vehicle platooning begins to break down.
Step Four: Safety Considerations
The consideration of safe intersection operations is an essential aspect covered in jurisdictional procedures, guidance documents, regulations, or legislation. A practitioner must ensure that traffic signals provide adequate clearance intervals (i.e. amber clearance and all-red) for the safe passage of all intersection users. The determination of these intervals is more prescriptive, and OTM Book 12 addresses this topic comprehensively. Further, other industry organizations have performed more thorough research into these topics.
Amber clearance, is presented as a lookup table in the OTM and is derived by a formula based on the perception and reaction time of drivers. Generally, the higher the posted speed limit, the greater the amber clearance value.
Similarly, there is a lookup table and formula to determine the appropriate duration for all-red clearance times at an intersection. This is typically based on the average length of a vehicle and the width of the intersection being crossed - essentially the time it takes for vehicles already in the intersection to get out. A wider intersection generally increases the all-red clearance value, whereas (in contrast) a higher posted speed limit generally lowers the all-red clearance value.
Looking at pedestrians, clearance intervals or flashing "don't walk" signals primarily factor the pedestrian walking speed and the distance of the pedestrian travering the intersection. The walk symbol as a minimum has a nominal length, such as 7 seconds or similar, depending on the jurisdiction. The flashing "don't walk" duration is often prescriptive, allowing pedestrians enough time to clear the intersection, with values ranging from less than 1.0 metres per second to up to 1.25 metres per second. Some jurisdictions may have policies specifying when different pedestrian speeds should be assumed (such as near schools) or for individuals with mobility challenges (such as the elderly).
Step Five: Evaluation and Adjustment
Utilize simulation or modelling software like Synchro, Vistro, or Vissim to evaluate the proposed traffic signal timings. While many models offer built-in automatic generation tools for traffic signal timings, it's crucial not to solely rely on these tools. Manually, review and evaluate the actual effectiveness and metrics of traffic signal timings.
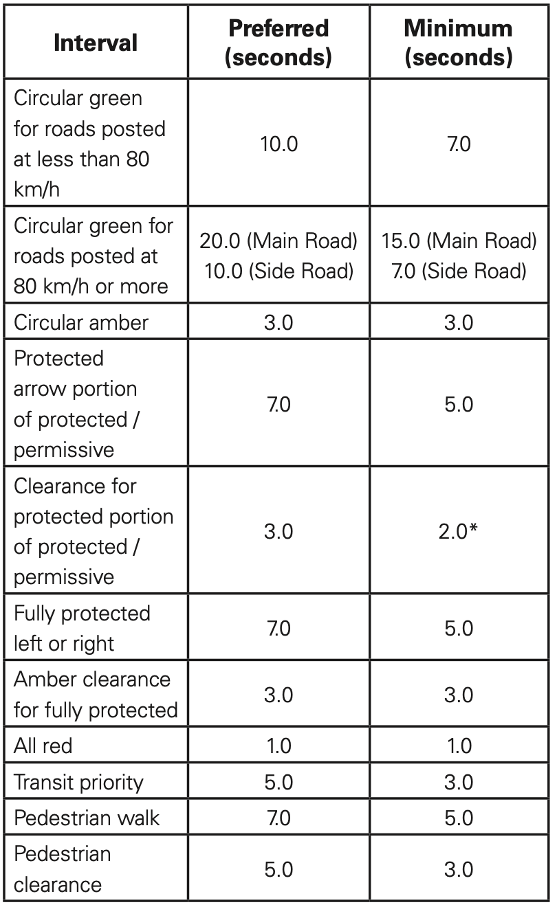
Beyond the fixed clearance intervals discussed in the previous step, refer to your jurisdiction's documents on signal timings to ensure that minimum times are met. For example, in the OTM Book 12, this includes minimum values for circular greens, advanced greens, pedestrian walk times, etc. - see below table.
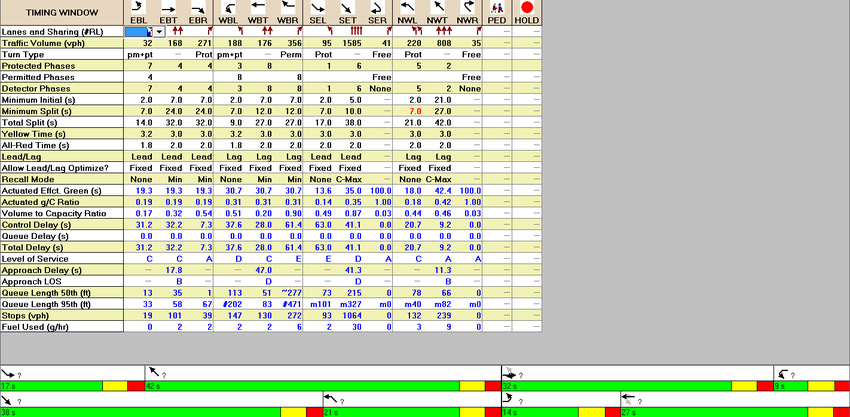
Once all fixed clearance and minimum interval times have been input into the modelling software, adjustments to the phase split for the intersection and cycle offsets to coordinate the entire corridor can be made to optimize traffic signal timings based on measured vehicle demands.
To better clarify for those learning: The phase splits represent how much time you allocate within the whole cycle length to a specific vehicle movement (phase) going straight or using a green arrow and include the clearance time; and, the cycle offsets are a value between zero and the cycle length at each intersection representing when the cycle begins and allows the traffic signals to be “synchronized” as vehicles travel along a corridor.
Start by running your software's automated evaluation tool for individual intersections to determine split times and clearance intervals for each signal phase. Then, manually review each intersection, adjusting the phase splits based on calculated metrics in the modelling software, local context knowledge, and an understanding of the desired traffic signal operation. Consider the operational impacts of potential vehicle detection failures, particularly for side streets and advanced left turns. When failures occur and detection is present, attempt to reduce the maximum split value to mitigate the impact on the main street in case of a detection failure.
Note that when the volume-to-capacity ratio exceeds one, raising the overall cycle length of the corridor should be considered. While this may reduce the volume-to-capacity ratio, it may have other operational impacts that should be discussed internally before implementation.
Once the phase splits for each vehicle movement at individual intersections are adjusted, and the overall intersection operations are satisfactory, step back and evaluate the overall corridor operations. While modelling software similarly provides automated tools for calculating recommended values for each intersection offset, it's essential to manually review the corridor to ensure that generated intersection offsets make sense.
Use the modelling tool's time-space diagram function to adjust cycle offsets manually, aiming to maximize the green band of progression between intersections. Depending on the time of day, a more directional green band may be desired (e.g. prioritizing traffic moving away from the city centre during the PM peak period) whereas other lower demand times may aim to balance the green band in both directions. When reviewing the time-space diagram green band, start with the maximum percentile and incrementally step down towards the 75th percentile to observe how operations are impacted. The green band will generally be wider in cases where semi-actuated operation is present.
Step Six: Implementation and Monitoring
Once the traffic signal timing plan has been reviewed and approved, it needs to be translated from your modelling software into a format readable by your traffic signal controller and ATMS (Advanced Traffic Management System). I must emphasize the importance of following your jurisdiction's proper testing steps and procedures to prevent the implementation of a faulty timing plan on a live intersection, which could potentially lead to flashing signal operations, posing increased safety risks.
It is recommended, where possible, to conduct a comprehensive test of your new timings within a traffic signal controller and cabinet to validate the timings before implementation. This is particularly crucial for newly commissioned intersections. In cases where adjustments are minor or involve existing intersections, the testing procedures may be simplified.
Once the signal timings are tested and approved for your jurisdiction's specific traffic signal controller model and cabinet, you can proceed with implementation at a live intersection. Implementation methods may include remotely loading the timings through your ATMS, physically loading the new timing database via a USB drive at the intersection, or manually adjusting the traffic signal controller buttons on-site. Ensure strict adherence to your jurisdiction's standard operating procedures to maximize safety and minimize risks and liabilities when changing traffic signal operations.
After successfully implementing new traffic signal timings in the field, it is vital to monitor their operations for a period post-implementation. Public feedback and criticisms are common, especially when changes negatively impact drivers’ travel experience. Despite potential negativity, it's crucial to consider the feedback and review your timings to ensure there are no lingering safety or liability concerns, even if the new signal timings ultimately pose no issues.
Conclusions
I trust that the outlined steps in developing traffic signal timings prove helpful to practitioners, especially those who are more junior or less experienced. Developing effective traffic signal timings involve both a data-driven process and a certain artistry. While the steps provided here offer a structured approach, it's important to note that this isn't always a prescriptive way to achieve new traffic signal timings. I strongly encourage less experienced staff to collaborate with their senior counterparts to gain knowledge and intuition in the development of appropriate traffic signal timings.
For those engaged in traffic signal timing, I invite your insights and perspectives on the steps outlined above. If you're a member of the public, does the information provided enhance your understanding of how traffic engineers and technologists perform their jobs?